1. How We Got There
Without a single Republican vote in either the House or Senate, the Democrats passed the Affordable Care Act in 2010 (though its major provisions did not go into effect until 2014). Throughout the process, they emphasized its market-based and bipartisan origins (as President Obama no doubt enjoyed reminding Governor Romney during the first 2012 presidential debate, the Republican candidate had established “essentially the identical plan” in Massachusetts several years prior to the ACA’s passage). The passage of the Affordable Care Act was a major political achievement for Democrats, the largest expansion of the U.S. safety-net in fifty years.[1] However, less than ten years later, there is a sense of mission unaccomplished. Last year, the Center for American Progress (CAP), the leading think tank of the Democratic Party establishment, opened their 2018 report on health reform saying: “The United States is alone among developed countries in not guaranteeing universal health coverage.” You would be forgiven if you thought that quote was from 2009, because Democrats used the identical motivation to pass the ACA. Plus ca change. The ACA substantially decreased the rate of uninsurance—it had been trending upward, from about 14 percent before the financial crisis to a peak of 18 percent in 2012, and was eventually driven down to a low of 10.9 percent by the end of the Obama administration.
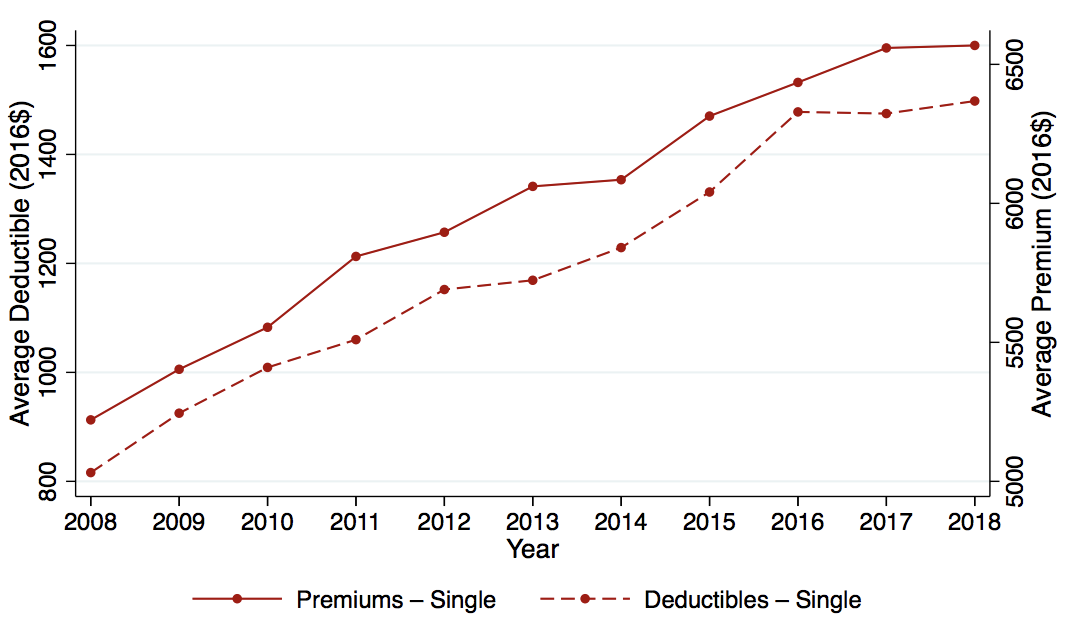
It has since ticked upward, back to 13.7 percent in a recent estimate.[2] It would surely have accomplished somewhat greater coverage had the Supreme Court not declared the original form of the Medicaid expansions unconstitutional, on federalism grounds, though the large majority of the population currently resides in Medicaid-expansion states. However, even at its nadir in 2016, the U.S. rate of uninsurance remained an extreme outlier among rich countries. And beyond the uninsured, 28 percent of non-elderly insured adults in the US remain underinsured (defined as having out-of-pocket medical costs exceeding ten percent of income).[3] Moreover, the ACA failed to deliver on its promise of lowering or at least containing the growth of premiums for those already insured. As Figure 1 shows, since 2006, premium growth for employer plans has grown steadily (by 27 percent in real dollars from 2006 to 2016), despite the fact that plans if anything have become less generous, with deductibles growing 112 percent over the same period. By contrast, this period saw no growth in median personal income.[4] Despite the mixed record of the ACA in terms of expanding coverage and lowering costs, Democrats seemed to have little desire to return to health care reform as an issue, until Senator Bernie Sanders’ quixotic run for the 2016 primary. And now, in a development that would have been very hard to predict even five years ago, many mainstream candidates are supporting “Medicare for All” in the 2020 Democratic Primary. Gone are the days of touting bi-partisan and market-based solutions.
Figure 1 Premiums and deductibles over time
2. What is Medicare and What Would Medicare for All Look Like?
Medicare covers the elderly and (after a two-year waiting period) those covered by Social Security Disability Insurance (SSDI). Enrollees have a choice between a traditional fee-for-service (FFS) program (which covers two-thirds of beneficiaries) and a menu of regulated, private plans (“Medicare Advantage,” which covers one-third of beneficiaries). FFS Medicare sets (and publishes) the prices they pay to providers, which are uniform except for some mild, mechanical geographic adjustment. By contrast, private insurers (in both Medicare Advantage and in the non-Medicare market) conduct bilateral negotiations with providers (leading in practice to substantially higher prices), and these contracts are considered propriety.
It is often claimed that “there are many paths to universal coverage,” with reference made to the variety of health systems other rich countries have. Many of these countries have a role for private insurers, for example. But, as I discuss in Section 5, all of these various programs are more similar to each other than to the U.S. system: prices are much lower and the role of private health insurers is much smaller than here. For the purposes of this memo, I think of Medicare for All as the extension of Medicare to the non-elderly and non-disabled populations. If there remains a role for private insurers (e.g., via continuation of the Medicare Advantage program and supplemental “Medigap” policies for Medicare beneficiaries) it would be much smaller than the current U.S. health insurance sector is today. The reform would eliminate two of the major current functions of private insurers: establishing networks of providers and negotiating prices with them. Instead, Americans could choose any provider that accepts Medicare and prices paid to drug makers, doctors, hospitals and device manufacturers would be negotiated by the federal government. Comparing the US to other countries and (within the US) comparing Medicare to the private sector suggest that on average these prices would be much lower than they currently are in the US. In my view, the limited role of private insurers and the lower prices gained via government negotiation are the two salient features any “Medicare for All” plan must have.
The next several sections describe the likely effects of such a reform on the major stakeholders of the current U.S. health system: current non-Medicare consumers, providers, private insurers, and, finally, current Medicare beneficiaries.
3. How Will Medicare for All Affect Non-Elderly Consumers?
It is often claimed that consumers would balk at being forced to give up employer-sponsored insurance (ESI) during the transition to Medicare for All. As the conservative columnist Megan McCardle bluntly puts it: “Sorry, Bernie, but most Americans like their health insurance the way it is.”[5]
Every day, roughly 10,000 people turn age 65 and become eligible for Medicare, allowing us to study how satisfaction with health care changes during the transition to Medicare. For this exercise, I use data from the Health and Retirement Survey (HRS) from 1995 to 2014. The HRS samples Americans age 50 and above (and their spouses, regardless of age) and is fielded every two years. I use the HRS to estimate “event-study equations,” which allows us to see how outcomes evolve before and after the “event” of turning age 65.[6] As Figure 2 shows, turning 65 is associated with a 75 percentage-point increase in the share of respondents saying their primary health insurance is via Medicare. As noted above, the disabled population are already on Medicare, which (along with a small amount of inevitable measurement error in survey data) explains why the change is less than one-hundred percent. The HRS asks all respondents to rate their satisfaction with their current health care (“Thinking about the quality, cost, and convenience of your health care, altogether would you say that you are very satisfied, somewhat satisfied, or not satisfied at all with your health care,” and respondents put themselves on a 1–5 scale). As shown in Figure 3, for the full population (the solid line), turning 65 is associated with a significant increase in stated satisfaction with health care. Satisfaction is high on average, but while Americans appear to like their health care generally, they are more satisfied with their healthcare once they are eligible for Medicare than before.[7]
Figure 2 Share of individuals on Medicare by age
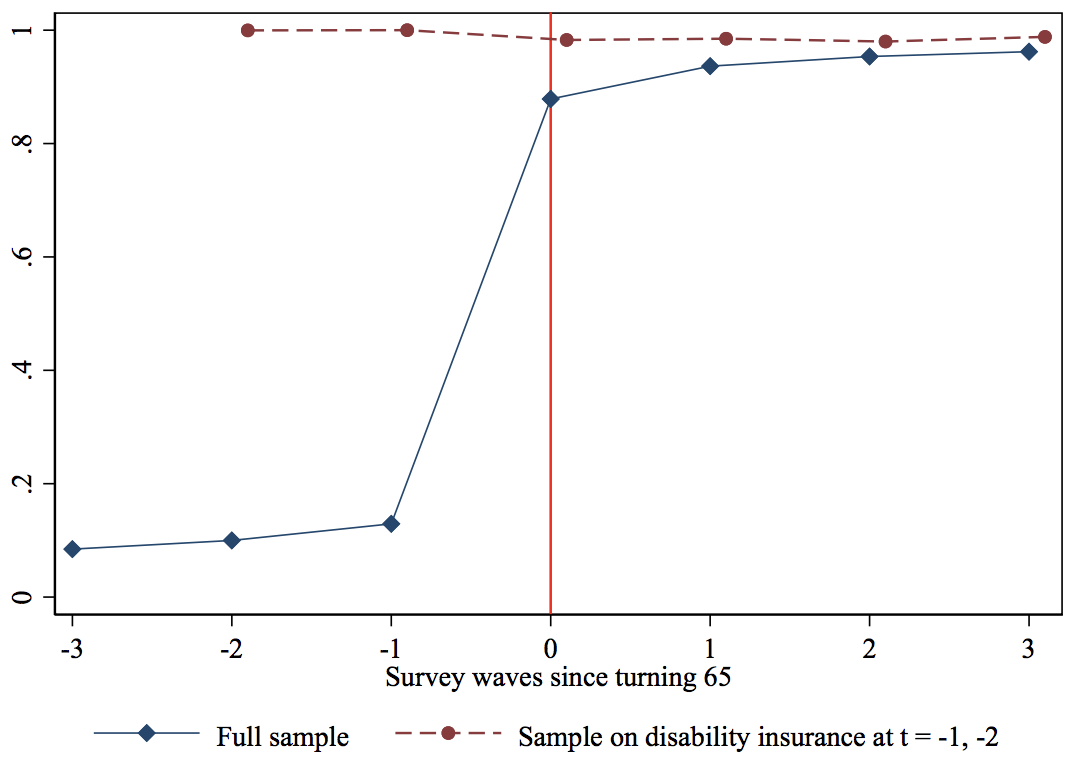
However, there are at least two limitations to this result. First, turning 65 is also associated with a spike in retirement, and thus the increase in satisfaction could be merely an “age 65” or a retirement effect (perhaps survey respondents are more likely to give positive assessments more generally once they retire). However, we see no discontinuous increase in satisfaction for those who are already on Medicare (via SSDI) in the two HRS waves before they turn 65 (the dashed line denoting the SSDI subsample in Figure 3).
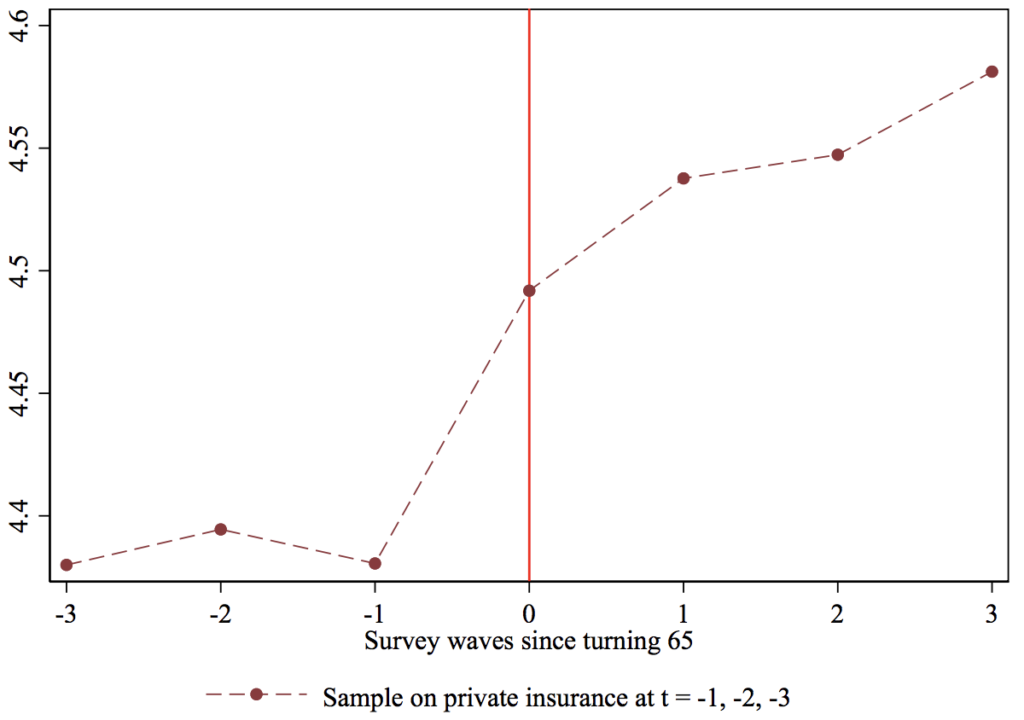
Second, the full sample includes those who have no insurance before Medicare or perhaps low-quality insurance from the individual market, making it an undemanding test of satisfaction with Medicare. Figure 4 thus examines the subsample of HRS respondents who have ESI in the three waves before they turn 65. Yet even those who are fortunate enough to have stable ESI (whom we might consider the aristocrats of the current private system) register an increase in satisfaction upon turning age 65 and joining Medicare.
Figure 3 Satisfaction with health care by age
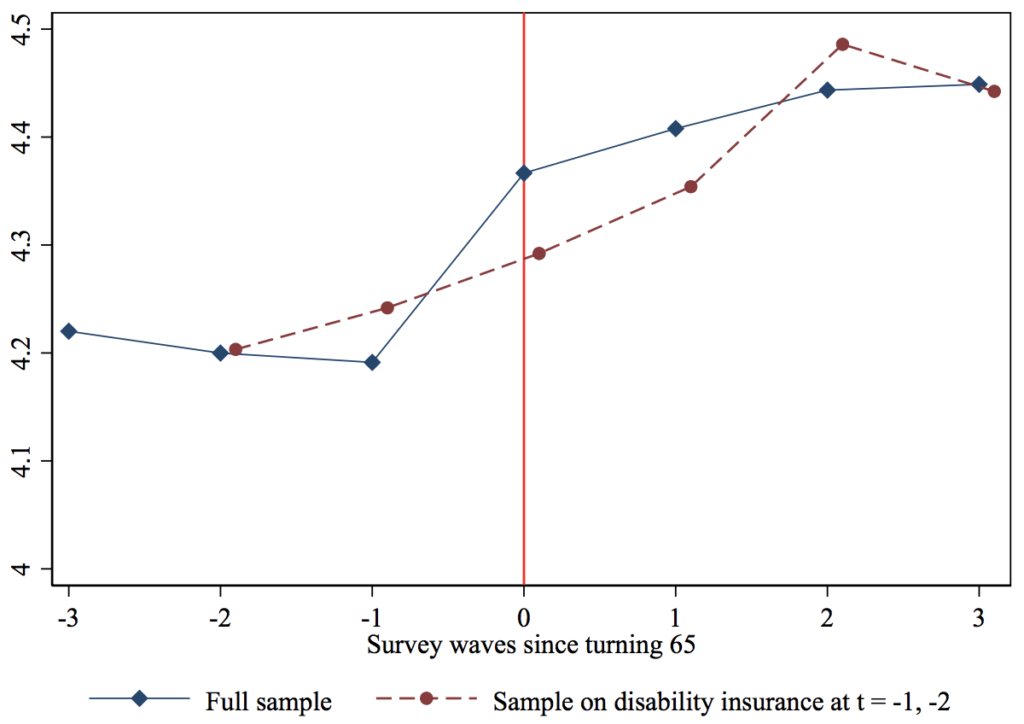
Figure 4 Satisfaction with health care by age, respondents on private insurance before age 65
Another important benefit of Medicare for All for the non-elderly is the ability to convert the implicit tax of ESI premiums to a lower (though more explicit) tax paid to the government. As Matt Bruenig has documented, when ESI premiums are considered as an (implicit) tax and added to (explicit) income and payroll taxes, American workers are in fact heavily taxed relative to our rich peers.[8] Given that high-wage workers do not consume substantially more health care than do middle-wage workers, the current system means that middle-wage workers sacrifice a larger share of total compensation for their (overpriced, at least relative to other countries) insurance coverage. Assuming that most of the savings would get passed back to workers via higher wages (and this point deserves more discussion in my view), then if the US replaced employer-sponsored insurance with an Medicare-for-all system, middle-wage workers’ take-home pay should proportionately rise relative to their better-paid counterparts. If such a system were financed with progressive taxation, the distributional effects would be even more attractive.
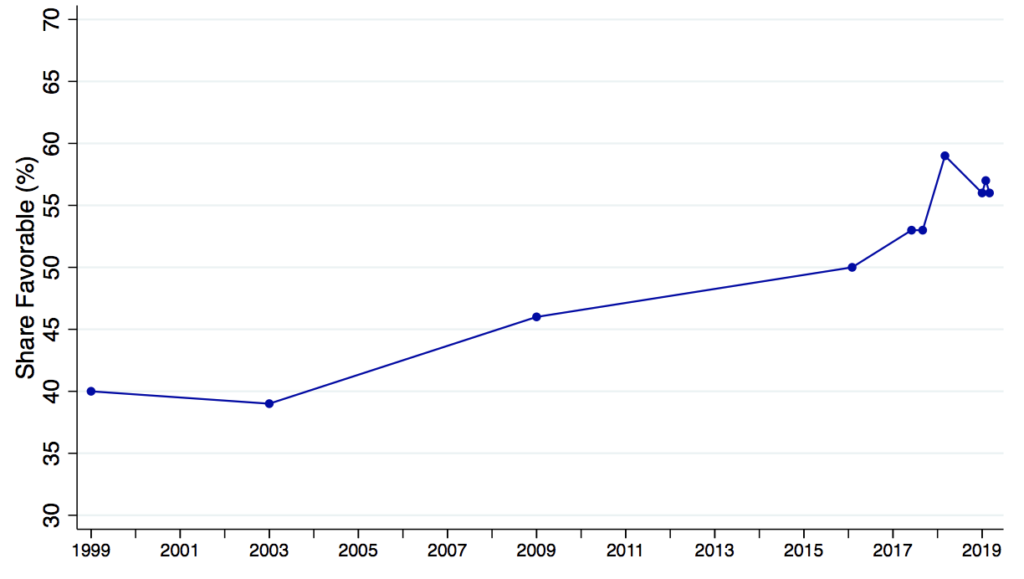
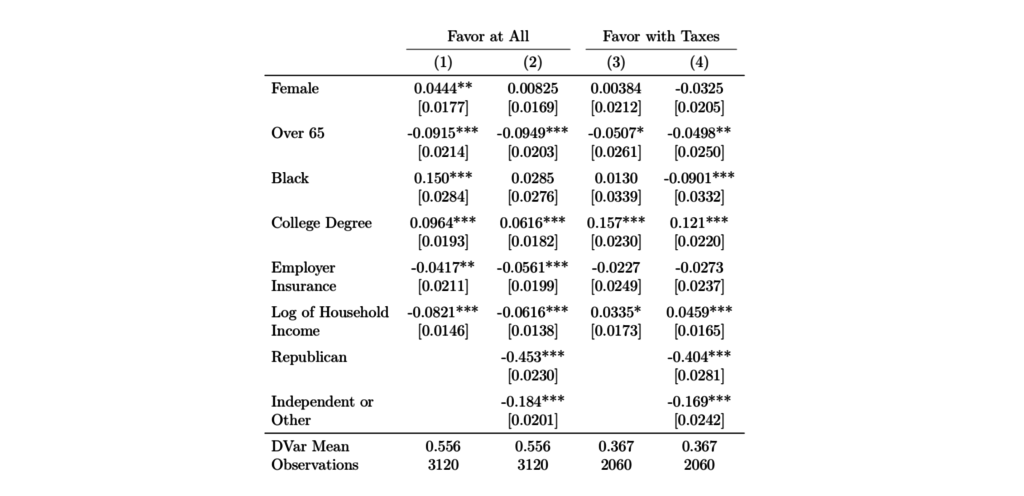
Indeed, as shown in Figure 5, support among the adult population in the US for a single-payer plan has been growing over time. For three of the data-points in this figure (two from 2017, one from 2018), I was able to obtain the underlying micro-data, which I analyze in the first two columns of Table 1. Not surprisingly, the nonelderly are more supportive of transitioning to a singlepayer plan, as are those who are currently without employer-sponsored insurance. The final two columns further analyzes the two 2017 surveys, which asked a follow-up question about support for such a plan if taxes were to rise substantially. Support predictably falls (to about 37 percent) and while the opposition of the elderly remains significant, no longer are those with ESI significantly less likely to support the reform. While the decline in support once taxes are emphasized cannot be dismissed, to the best of my knowledge no survey has emphasized that these taxes would replace the premiums currently paid by workers and employers.
Figure 5 Public support for a national health plan over time
Of course, convincing the millions of U.S. households that currently have ESI to support a major overhaul of their health insurance is no easy task. Some households may value a choice of plans and (depending on the exact form Medicare for All would take) the reform would likely limit choice. And an important and open question is how Medicare for All would guarantee that the resulting savings in national health expenditure get passed on to workers in a salient manner. But the experience of the millions of 65-year-olds who have experienced the ESI-to-Medicare transition first-hand should serve as a valuable argument in favor of Medicare for All.
4. How will Medicare for All Affect Providers?
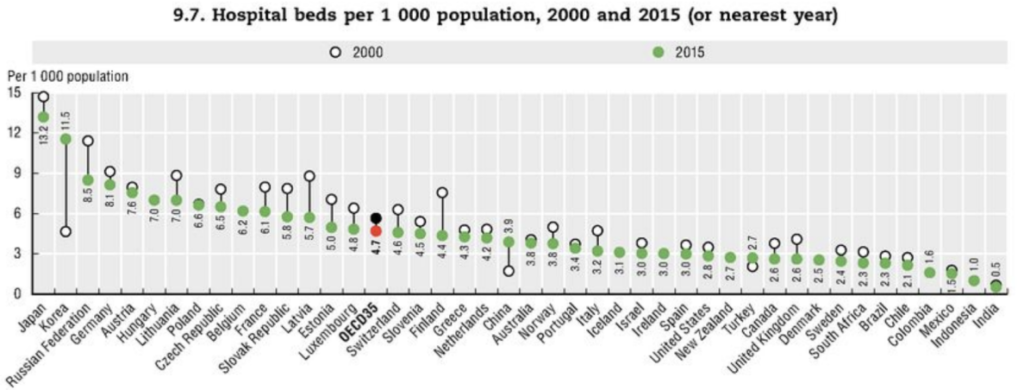
While perfect comparisons are hard to make, evidence points to the US paying substantially higher prices than other rich countries. First, as Anderson et al. (2003) were among the first to emphasize, while U.S. total health spending (P · Q) is far greater than peer nations, utilization (Q) is modest, suggesting prices must explain the high spending. Figure 6 shows that the US is below the OECD average with respect to hospital beds per capita (similar results, not shown here, hold for doctors and nurses per capita, as well as length of stay for common inpatient events such as a vaginal delivery or a heart attack). Second, what cross-country price data do exist support the view that prices in the US are uniquely high. For example, the average price for an MRI (which I choose because it is a relatively homogeneous medical service, for which complications are essentially non-existent) is forty percent higher in the US than in the UK.[9] While more and better data would facilitate better cross-country price comparisons, the evidence so far points to prices being a key if not the main driver of American exceptionalism with respect to outlier health spending.[10]
Figure 6 Hospital beds per 1,000 population
The highest-quality and most widely available health data in the US comes from FFS Medicare, which, as noted above, has essentially no price variation. It is thus not surprising that health economists studying the U.S. market have focused on understanding utilization patterns. For example, the famed Dartmouth Atlas project uses FFS Medicare data to identify hospital referral regions (HRRs) that exhibit higher utilization even after controlling for area demographics.[11] As Medicare is a huge program, understanding utilization patterns is of obvious importance.
However, in my view, it was not emphasized nearly enough by researchers that although variation in utilization explains (by construction) nearly one hundred percent of across-HRR variation in Medicare spending, it need not be the case that quantity variation is equally important in explaining U.S. health spending patterns outside Medicare or that quantity variation explains why the US spends more than other countries. Indeed, recent work by Cooper et al. (2019) suggests that price variation is just as important as quantity variation in explaining across-HRR spending variation in the private insurance market and in fact the correlation between FFS Medicare spending and private insurance spending across HRRs is close to zero.
This neglect of prices by researchers influenced the public debate as well as the design of the ACA. Instead of focusing on the anomalously high prices paid by U.S. private insurers, pundits and policy-makers targeted over-utilization (too much Q). The New Yorker published an influential 2009 piece by Atul Guwande on the wasteful practices of high-spending HRRs (which made McAllen, Texas infamous among health policy wonks), based entirely on Medicare data. Peter Orszag, Obama’s first director of the Office of Management and Budget and a key player in health reform at the time, is quoted glowingly, emphasizing how much could be saved if only high-spending places adopted the practices of low-spending places.[12] I worked in the Obama Administration from 2009 to 2010 on the inter-agency health reform team and can recall making arguments about consumers needing “more skin in the game” in order to “bend the health care cost curve” (arguments I now think are mostly wrong).
Perhaps the best evidence that ACA architects ignored the role of high provider prices was that they secured the endorsements from the major provider lobbyist groups (the American Medical Association, the Pharmaceutical Research and Manufacturers of America, and the American Hospital Association). This time around, even more moderate reformers from the center-left are hip to the price argument. As CAP writes: “[The governments of other developed countries] use their leverage to constrain provider payment rates….This is the main reason why per capita health care spending in the United States remains double that of other developed countries.”
Providers will be a natural opponent of Medicare for All. Given that physicians and other medical professionals enrolled in multi-year post-secondary programs and took on debt under the assumption of enjoying the uniquely high prices of the current U.S. system, debtrelief for recent graduates of these programs could be considered part of the transition package.
5. How will Medicare for All Affect Private Insurers?
Most rich countries with universal coverage have some role for private plans (either in administering basic benefits largely funded by general tax dollars or in providing insurance for supplemental coverage, akin to private “Medigap” plans in the U.S. Medicare market). As CAP writes: “In developed countries, health systems that guarantee universal coverage have many variations,” ranging from UK’s National Health Service, which owns hospitals and directly employs physicians, to the system in Germany, where “more than 100 nonprofit insurers… are payers regulated by a global budget, and about ten percent of Germans buy private insurance, including from for-profit insurers.” These examples are given to argue that “there are many paths to universal coverage” and Medicare for All is but one path.
I take Germany as a case study, given it is often used as an example of a universal system with an active private insurance market. What is the private health insurance market like in Germany?
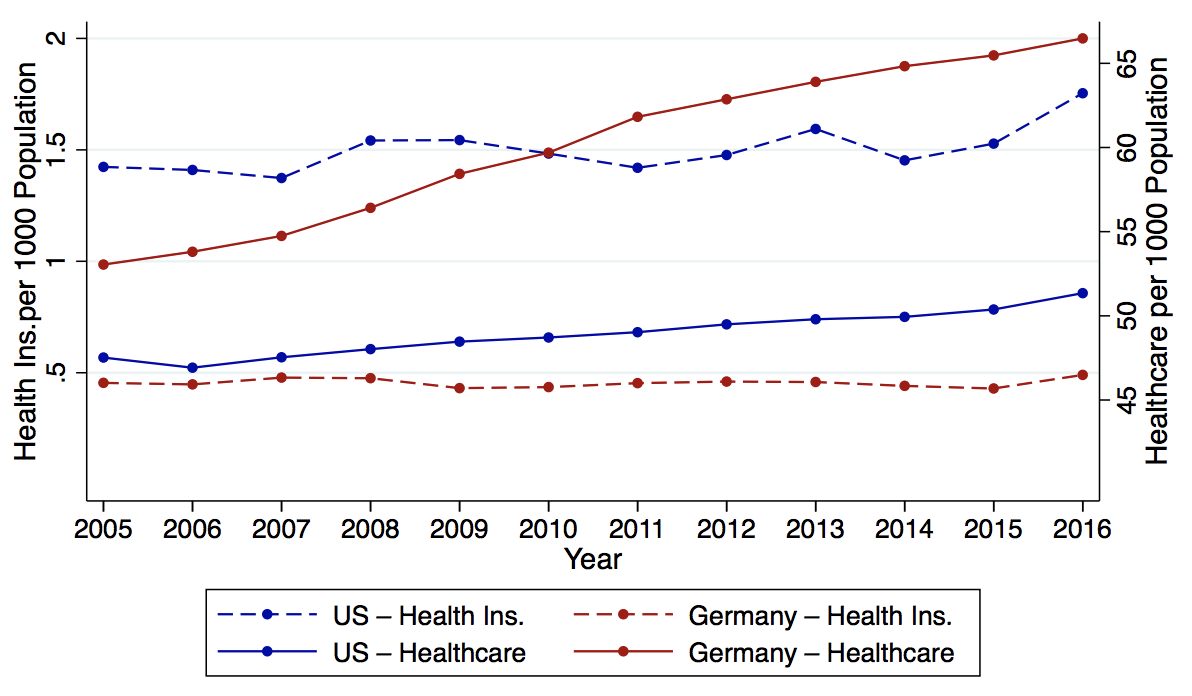
The first salient fact is that the German health insurance sector is much smaller than that in the US. Figure 7 compares employment in the health insurance sector versus the health care sector (all per capita). As would be expected given relatively modest levels of U.S. health utilization, Germany has a greater number of healthcare workers per capita (65 versus 50 per 1,000 people). However, the reverse is true for employment in the health insurance industry: the U.S. has three times the per capita level of Germany (over 1.5 versus just under 0.5 per 1,000).
Figure 7 Health care and health insurance industry workers, US and Germany
The small German health insurance sector is not surprising: German health insurance plans do not do much, relative to their American counterparts. Germans can choose any GP, specialist or hospital they wish, so plans do not form “networks” as they do here. Providers are paid under a FFS scheme via a uniform fee schedule set by the government, again eliminating the key role that private insurers play here, negotiating prices with providers.In summary, while saying that Germany has many private plans is technically correct, the point seems largely irrelevant. It is hard to imagine that the health insurance lobby (AHIP, America’s Health Insurance Plan) would remain neutral (as they did during the ACA debates) over a plan to move the US to the German model of universal coverage. Medicare for All—even if implemented via the supposedly more insurer-friendly “German model”—would lead to significant downsizing of the health insurance industry
6. How Will Medicare for All Affect Current Medicare Beneficiaries?
In principle, Medicare for All should not affect current seniors. Politically, however, they are a key stakeholder in the status quo system.
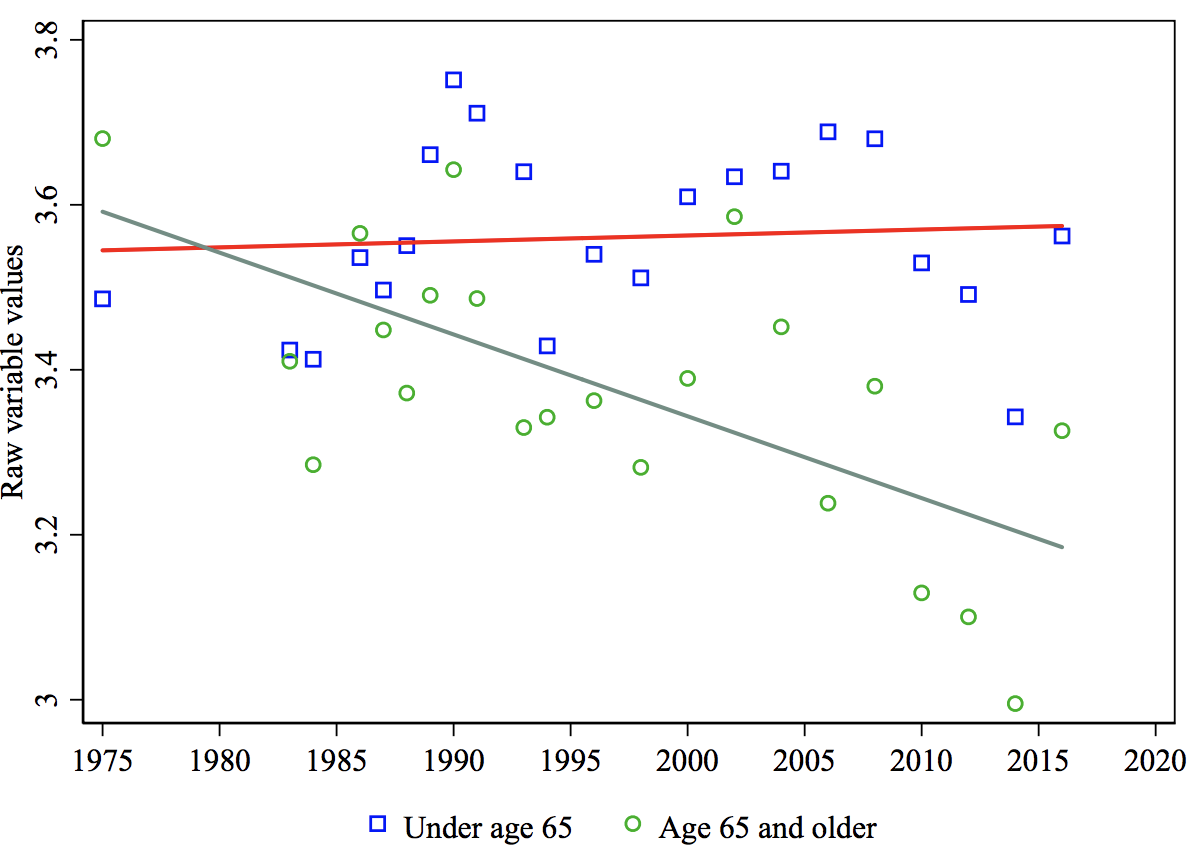
Seniors already have Medicare. For them, “Medicare for All” is “Medicare for Others.” As Ashok et al. (2015) show, over the past several decades, seniors in the US have grown increasingly wary of government redistribution (Figure 8), and in particular the idea that the government has the obligation to help U.S. citizens with medical bills (Figure 9). Interestingly, Ashok et al. (2015) show that the differential decline in support for redistribution among the elderly relative to others is uniquely American, consistent with the idea that seniors in the US (which, unique among other rich countries, guarantees health care only to the elderly) fear that further redistribution will come at the expense of Medicare. As already noted, seniors are substantially less likely than the rest of the population to support a universal, single-payer health reform (see Table 1).
Figure 8 Government should reduce income dierences: Age trends

Politicians who oppose Medicare for All appear acutely aware of the elderly’s suspicions. As President Trump claimed during a rally before the 2018 midterm elections, Democrats “want to raid Medicare to pay for socialism.”[13]
Figure 9 Government should help people pay for medical care: Age trends
Politically, it might be helpful to retain a special status for the elderly even within a Medicare-for-All program. One idea might be to have slightly higher reimbursement rates for providers who serve this population.
7. Open Questions
My read of the evidence (and my own social welfare weights, which place great weight on the un- and under-insured as well as middle-class workers who are implicitly taxed via expensive health plans) lead me to conclude that Medicare for All would increase welfare in the US. However, I also want to highlight what I consider the biggest risks of such a policy.
First, do the savings enjoyed by Medicare via lower prices come at the expense of the privately insured? Providers argue that they are only able to endure Medicare’s slim (or even negative) margins because they make up (“cost-shift,” in the parlance of health economists) these losses in the commercial market.[14] If Medicare has these spillover effects onto the private market, then some of the cost-savings I attribute to Medicare are overstated. Unfortunately, there is no clear consensus on the cost-shifting question, though the recent availability of high-quality price data from the commercial market should help researchers make progress in this area.
Second, would the savings that employers would gain by no longer funding the uniquely expensive U.S. healthcare system be passed on to workers? I have flagged this question throughout the memo as it is obviously key to the political feasibility of Medicare for All. Taxes would obviously rise to fund Medicare for All, so the increases in wages must be larger than the tax hikes and saliently so.
Third, and perhaps most important, would Medicare for All lead to less medical innovation, which might not only hurt Americans but the rest of the world as well? It is often argued that high prices in the US induces innovation, from which the entire world might benefit. Indeed, while the US exhibits lower-than-average utilization in most categories, key exceptions tend to be technology-intensive procedures (e.g., MRIs and other imaging services). There is indeed convincing evidence that medical innovation responds to financial incentives. In particular, past work has shown that increases in market size induce innovation, so thus by reducing prices paid to providers Medicare for All likely reduces market size and could chill innovation.[15]
While these papers point to financial incentives being an important driver of innovation in the current U.S. health care system, they provide at best indirect evidence of how innovation would evolve if the US moved to a Medicare-for-All-type system and in fact some results from the existing literature suggest deadweight loss of the current system. For example, Krieger et al. (2018) argue that even large pharmaceutical firms are often too risk-averse and cashflow-limited to pursue truly innovative, high-risk-high-reward research, and, similarly, Budish et al. (2015) contend that firms’ eschew long-term research despite potentially large welfare gains. The government has an advantage over firms for projects that demand liquidity and long horizons. Akcigit and Liu (2015) argue that an underappreciated cost of private R&D is that firms have an incentive to befuddle their competitors and thus many firms wind up pursuing lines of research that other firms had previously found to be dead-ends. Again, government coordination of research would avoid this problem.
My sense from reading the literature is that we do not have a good sense of what would happen to medical research and innovation in a world without outsize U.S. prices for medical care. At the very least, given the importance of medical innovation, it would seem prudent to dedicate a substantial portion of the national savings from moving to Medicare for All to publicly funded health research.
The recent interest for Medicare for All increases the need for research on these open questions.
Table 1 Favor having a single government health plan
Endnotes
[1]A quote from Nancy Pelosi, the Speaker of the House at the time of its passage, summarizes the triumphant sentiment: “After a year of debate and hearing the calls of millions of Americans, we have come to this historic moment. Today we have the opportunity to complete the great unfinished business of our society and pass health insurance reform for all Americans that is a right and not a privilege.”
[2]See https://news.gallup.com/poll/246134/uninsured-rate-rises-four-year-high.aspx.
[3]See https://www.commonwealthfund.org/publications/issue-briefs/2017/oct/how-well-does-insurance-coverage-protectconsumers-health-care?redirect_source=/publications/issue-briefs/2017/oct/insurance-coverage-consumers-health-care-costs.
[4]See https:\www.kff.org\health-costs\report\2018-employer-health-benefits-survey\.
[5]See https://www.washingtonpost.com/opinions/2019/05/03/sorry-bernie-most-americans-like-their-health-insurance-wayit-is/?utm_term=.d10c808324e1.
[6]Specifically, I estimate equations of the of the following form:

where i indexes the individual, event-time Eiw is measured as the number of survey waves between wave w and the survey wave during which individual i turns 65. The coefficient β-1 is normalized to 0, though I then add the mean of the dependent variable at t=-1 to all the βs. The outcome variable Y is either a dummy variable for whether the respondent’s main source of insurance is Medicare (the “first stage” of the analysis) or her satisfaction with her health care (the “second stage,” measured on a 1–5 scale).
[7]Unfortunately, the HRS does not further ask respondents to breakdown their satisfaction separately by quality, cost and convenience, so it is not possible to know which of these components drives the increase in satisfaction at age 65.
[8]See https://www.peoplespolicyproject.org/2019/04/08/us-workers-are-highly-taxed-when-you-count-health-premiums/.
[9]See https://fortunedotcom.files.wordpress.com/2018/04/66c7d-2015comparativepricereport09-09-16.pdf for a variety of price comparisons for medical procedures and drug prices among rich countries.
[10]The complication, of course, is ensuring true apples-to-apples comparisons across countries in a given procedure. As Baicker and Chandra (2018) note, comparing, say, the number of trips to an oncologist in the US versus another country is difficult, as in the US the oncologist might be board-certified radiation oncologist as opposed to a general oncologist.
[11]HRRs have a minimum population of 120,000 and there are roughly 300 HRRs in the US.
[12]Recent work by Finkelstein et al. (2016) shows that when FFS Medicare beneficiaries move from a low-cost to a high-cost HRR, their Medicare spending indeed increases. But the magnitude of the effect suggests that only half of the variation is explained by the HRR itself and the other half explained by patient-level variation (likely unobserved heterogeneity in health or preference for more intensive treatment). As such, the claim that high-spending places could simply adopt the practices of low-spending places and enjoy the same low spending is likely an oversimplification.
[13]See https://www.vox.com/2018/9/7/17827436/medicare-socialism-trump-scott.
[14]See https://www.nytimes.com/2019/04/21/health/medicare-for-all-hospitals.html for a recent discussion of cost-shifting in the hospital sector and potential losses to the sector under Medicare for All.
[15]See, e.g., Acemoglu and Linn (2004), Dubois et al. (2015) and Blume-Kohout and Sood (2013).
References
Daron Acemoglu and Joshua Linn. Market Size in Innovation: Theory and Evidence from the Pharmaceutical Industry*. The Quarterly Journal of Economics, 119(3):1049–1090, 08 2004. ISSN 0033-5533. doi: https://doi. org/10.1162/0033553041502144.
Ufuk Akcigit and Qingmin Liu. The role of information in innovation and competition. Journal of the European Economic Association, 14(4):828–870, 2015.
Gerard F. Anderson, Uwe E. Reinhardt, Peter S. Hussey, and Varduhi Petrosyan. Its the prices, stupid: Why the united states is so different from other countries. Health Affairs, 22(3):89–105, 2003. doi: https://doi.org/10.1377/ hlthaff.22.3.89.
Vivekinan Ashok, Ilyana Kuziemko, and Ebonya Washington. Support for redistribution in an age of rising inequality: New stylized facts and some tentative explanations. Brookings Papers on Economic Activity, 2015.
Katherine Baicker and Amitabh Chandra. Challenges in understanding differences in health care spending between the united states and other high-income countries. JAMA, 319(10): 986–987, 2018. doi: https://doi.org/10.1001/ jama.2018.1152.
Margaret E Blume-Kohout and Neeraj Sood. Market size and innovation: Effects of medicare part d on pharmaceutical research and development. Journal of Public Economics, 97:327– 336, 2013.
Eric Budish, Benjamin N. Roin, and Heidi Williams. Do firms underinvest in long-term research? evidence from cancer clinical trials. American Economic Review, 105(7):2044– 85, July 2015. doi: 10.1257/aer.20131176. URL http:// www.aeaweb.org/articles?id=10.1257/aer.20131176.
Zack Cooper, Stuart V Craig, Martin Gaynor, and John Van Reenen. The price aint right? hospital prices and health spending on the privately insured. The Quarterly Journal of Economics, 134(1), 2019. doi: https://doi.org/10.1093/ qje/qjy020.
Pierre Dubois, Olivier de Mouzon, Fiona Scott-Morton, and Paul Seabright. Market size and pharmaceutical innovation. The RAND Journal of Economics, 46(4):844–871, 2015. doi: 10.1111/1756-2171.12113.
Amy Finkelstein, Matthew Gentzkow, and Heidi Williams. Sources of geographic variation in health care: Evidence from patient migration. The Quarterly Journal of Economics, 131(4):1681–1726, 2016. doi: https://doi.org/10.1093/ qje/qjw023.
Joshua L Krieger, Danielle Li, and Dimitris Papanikolaou. Developing novel drugs. Technical report, National Bureau of Economic Research, 2018.
Share:


